Show me the data (part 2)
 Image credit: https://hackersbyrez0.com/
Data collection, preparation, and cleaning take up to 80%–90% of time for an ML project. Therefore, it is not surprising that we need to cover it on multiple blogs.
In the first part, we talked mainly about theory: how we collect data from our systems and how we store it. We introduced data parsing using logs. In this second part, we will analyze more code examples useful for plain text parsing and packet capture. In addition, it is time to introduce the pandas library for structuring our data. We start with the 1,000-foot view and then dive deep into it.
You will find the code from this blog in the notebook blog_show_data_2.ipynb.
1,000 ft view
Our roadmap of what is covered is listed below.
- Cybersecurity Data
    - Logs/Events (part 1)
        - syslog
        - server log
        - host event logs
    - Pandas (we are here)
    - Unstructured text
        - domains
        - urls
    - Binaries
    - Traces (part 3)
        - pcaps
        - netflow
Pandas
The most prevalent tool that data scientists use is the Pandas library. The Pandas library implements a data structure called a “DataFrame” that is used to organize data in Excel-style tables. The columns of the Dataframe are called Series and represent another data structure that is handy for organizing data in single-column, multi-row arrays. DataFrames are composed of concatenated Series.
The first reason that Pandas is the go-to tool for ML is that it offers a clean way to organize large amounts of data in an efficient structure. The second reason is the Pandas API, i.e., their functions, which offer a versatile amount of operations to be done on the data. We will be using Pandas a lot; therefore, I will discuss some of their basic functions here.
Pandas basics
Let’s start with an example of how to read your csv with one line of code:
import pandas as pd

mirai = pd.read_csv("../data/blog_show_data/mirai.csv")
mirai

You can access individual columns of your Dataframe that as explained above are another type of data structure, pandas.core.series.Series:
mirai_series = mirai["Source"]
type(mirai_series)
You may also access a subset of the rows of the dataframe with indexing, [start_row:end_row]:
mirai[0:3]

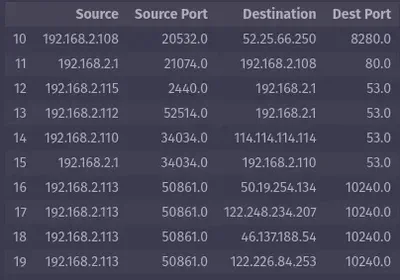
You can access a part of the rows and a subset of the columns of a Dataframe with the code below, where we access rows 10-20 and the second, seventh, third, and eighth columns:
mirai.iloc[10:20, [2, 7, 3, 8]]

Finally, one of my favorite access functions is to use a condition to access specific rows, as in the code below where we access rows with packet length greater than 512:
mirai_data[mirai_data["Length"] > 512]
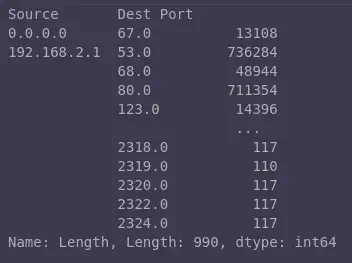
You can also perform some pretty neat aggregations. For example, sum all the packet lengths for specific Source IP and Destination Port pairs from rows 0-990:
mirai_data.groupby(["Source", "Dest Port"]).sum()["Length"][0:990]

Tips
Here are my three tips for Pandas that I learned the hard way:
- Use the API documentation and functions when you can. Before you build something, check if there is a function for it.
- Use lambda functions instead of regular for loops. I will dedicate a part of my exploratory data analysis blogs to this and show you the way I approach lambdas.
- Be particularly cognizant when you are modifying the shape or index of your Pandas structures, particularly dataframes. More examples will come your way when we explore the data!
One of my favorite tutorials for Pandas is Illustrated Pandas.
Text
We just discussed syslog parsing; however, there are other forms of text. Here again, I take the approach: if there is a Python package, use it and do not reinvent the wheel.
Domains
My go-to Python library for domains is tldextract because it is a simple way to parse your domain without having to use regular expressions.
import tldextract
import pandas as pd

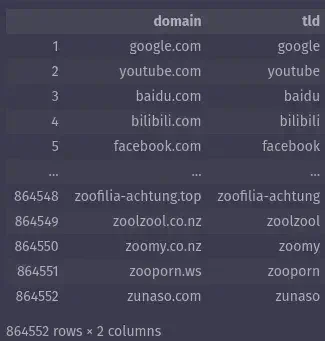
legit_domains = pd.read_csv("../data/blog_show_data/top-1m.csv", names=["domain"])
legit_domains["tld"] = [tldextract.extract(d).domain for d in legit_domains["domain"]]

legit_domains

In this example, I am reading a file with 1 million domains and extracting the top-level domain and subdomain.
URLs
If you have payloads with urls, a great package to use is urlextract.
import urlextract

# Create an instance of URLExtract class
url_extractor = urlextract.URLExtract()

# Sample text containing URLs to be extracted
dns_payload = "www.googleadservices.com: type A, class IN, addr 142.251.32.194"

# Extract URLs from the given text
extracted_urls = url_extractor.find_urls(dns_payload)

print("Extracted URLs: ", extracted_urls)
In this example, I extracted the url from a DNS payload.
Binaries
Most malware comes in binary form. There are a lot of libraries in Python used to load your binary data. However, I strongly recommend not reinventing the wheel, since there are sandboxes that can analyze these binaries and give you the metadata that you need. I personally have used the following to generate metadata that is structured and easy to process with ML:
- Cuckoo: After you upload any binary file, Cuckoo generates a complete report that is structured in JSON and contains packet captures for further analysis. You can set it up locally or use their Cuckoo public server.
- LiSa: Along the same lines, LiSa generates a JSON report and pcaps for analyzed elf files. However, you will either need to set up the containers locally or ask for an account from ELF Digest). LiSa is great for IoT malware analysis, and it has an API, so if you setup the containers, you can use the API to automate your analysis process.
- MobSF: The Mobile Security Framework is great for analyzing APKs. You can use the MobSF server or a local installation. It includes an API and generates metadata in the form of PDF reports that can be analyzed with Python.
Recap
In this blog, we have reviewed Pandas, an important data structure for processing data. In addition, we explored two more categories of cybersecurity data: text and binary. I saved the best for last; we will review network data analysis tools in the last blog on cybersecurity data.
– Xenia
Going Even Deeper
Code examples for this blog can be found in cyber-ml repo.
Python libraries for binary analysis:
- pyelftools: analysis for ELF files.
- Androguard: reverses APKs.
- radare2: reverse engineering library.
- yara-python: Python interface for YARA.
Pandas favorites: